Google Analytics vs Plausible Analytics: Website Analytics Review for Small Businesses
Introduction
Website analytics is a powerful tool for understanding and improving your audience. It involves collecting, analyzing, and reporting data about how people interact with your website. This data provides insights into visitor behavior, preferences, and demographics, helping businesses optimize their online content, improve user experience, and make informed marketing decisions. In today’s digital age, where having a strong online presence is crucial for success, website analytics has become an indispensable tool for businesses of all sizes.
Google Analytics has long been the standard web analytics tool, offering a comprehensive suite of tools to track and analyze website traffic. However, Plausible Analytics has emerged as a great alternative to Google Analytics, especially for startups and small businesses looking for a simpler, easy-to-learn approach. It addresses many of the pain points that small business owners face when using Google Analytics: for example, it is a much more privacy friendly analytics tool, it’s much simpler and easy to use, and has far less of an impact on website loading times.
In this article
In this Plausible Analytics review, I’ll compare Plausible vs Google Analytics from the perspective of small business owners and entrepreneurs. I will explore how each platform fares in key areas such as:
- Ease of use
- Features relevant to small businesses
- Providing actionable insights
- Data privacy
- Cost
Boujee Brands is a web design agency based in California offering affordable websites to contractors and small businesses. We provide Plausible Analytics to all of our clients for free as part of our web design packages.
Google Analytics vs Plausible Analytics: website traffic and visitor behavior
How many people are looking at my website?
Google Analytics
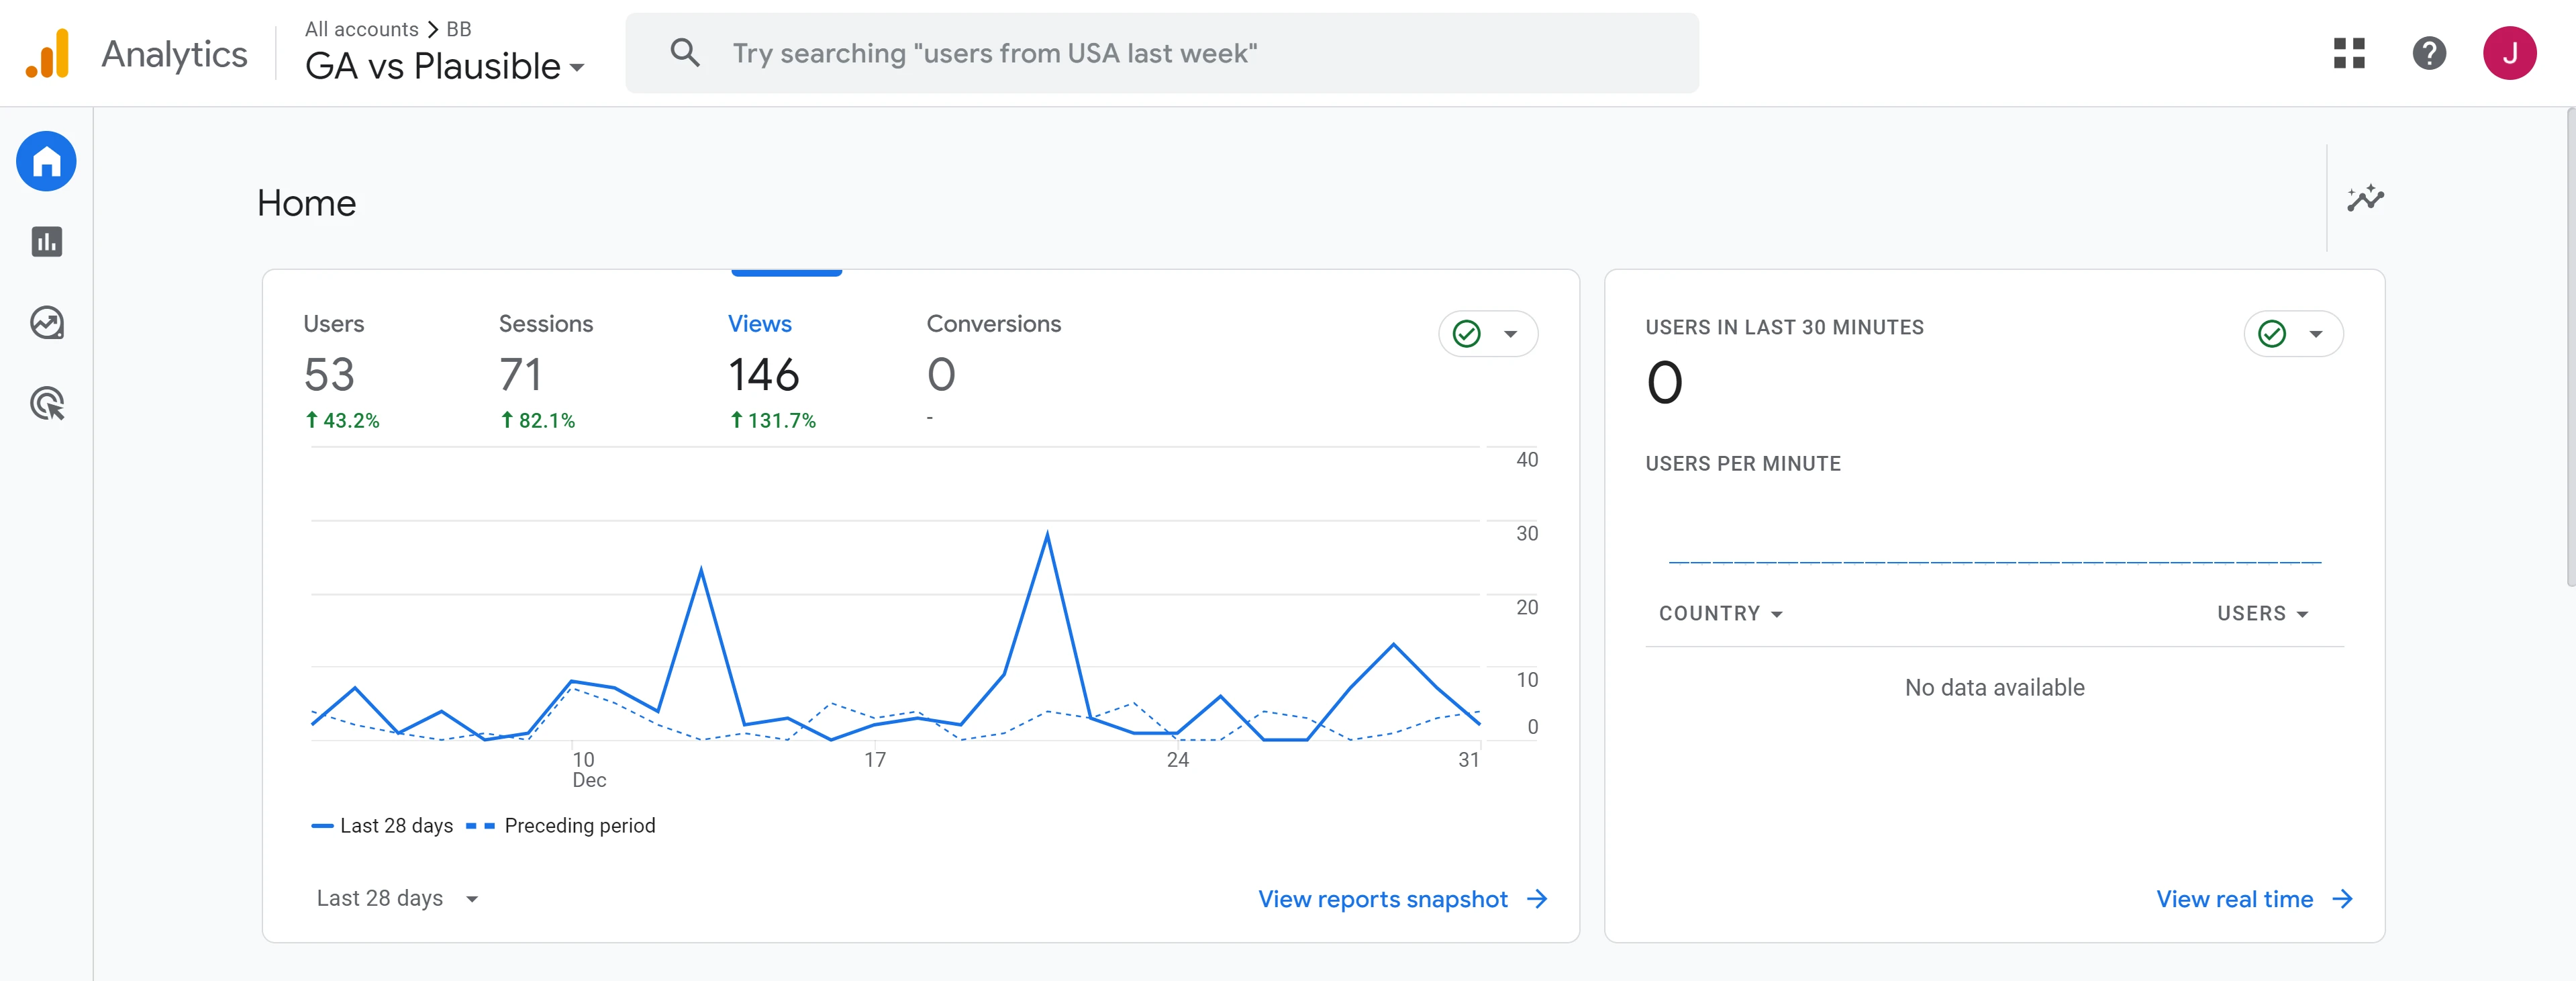
Google Analytics, while powerful, can be overwhelming due to its complex terminology and its data presentation. Terms like users, active users, new users, sessions, and default channel group are used, but their meanings and measurement criteria can be unclear, and can vary depending on your settings. This complexity makes it challenging to get a straightforward answer to the simple question: “How many people are looking at my website?“.
Plausible Analytics
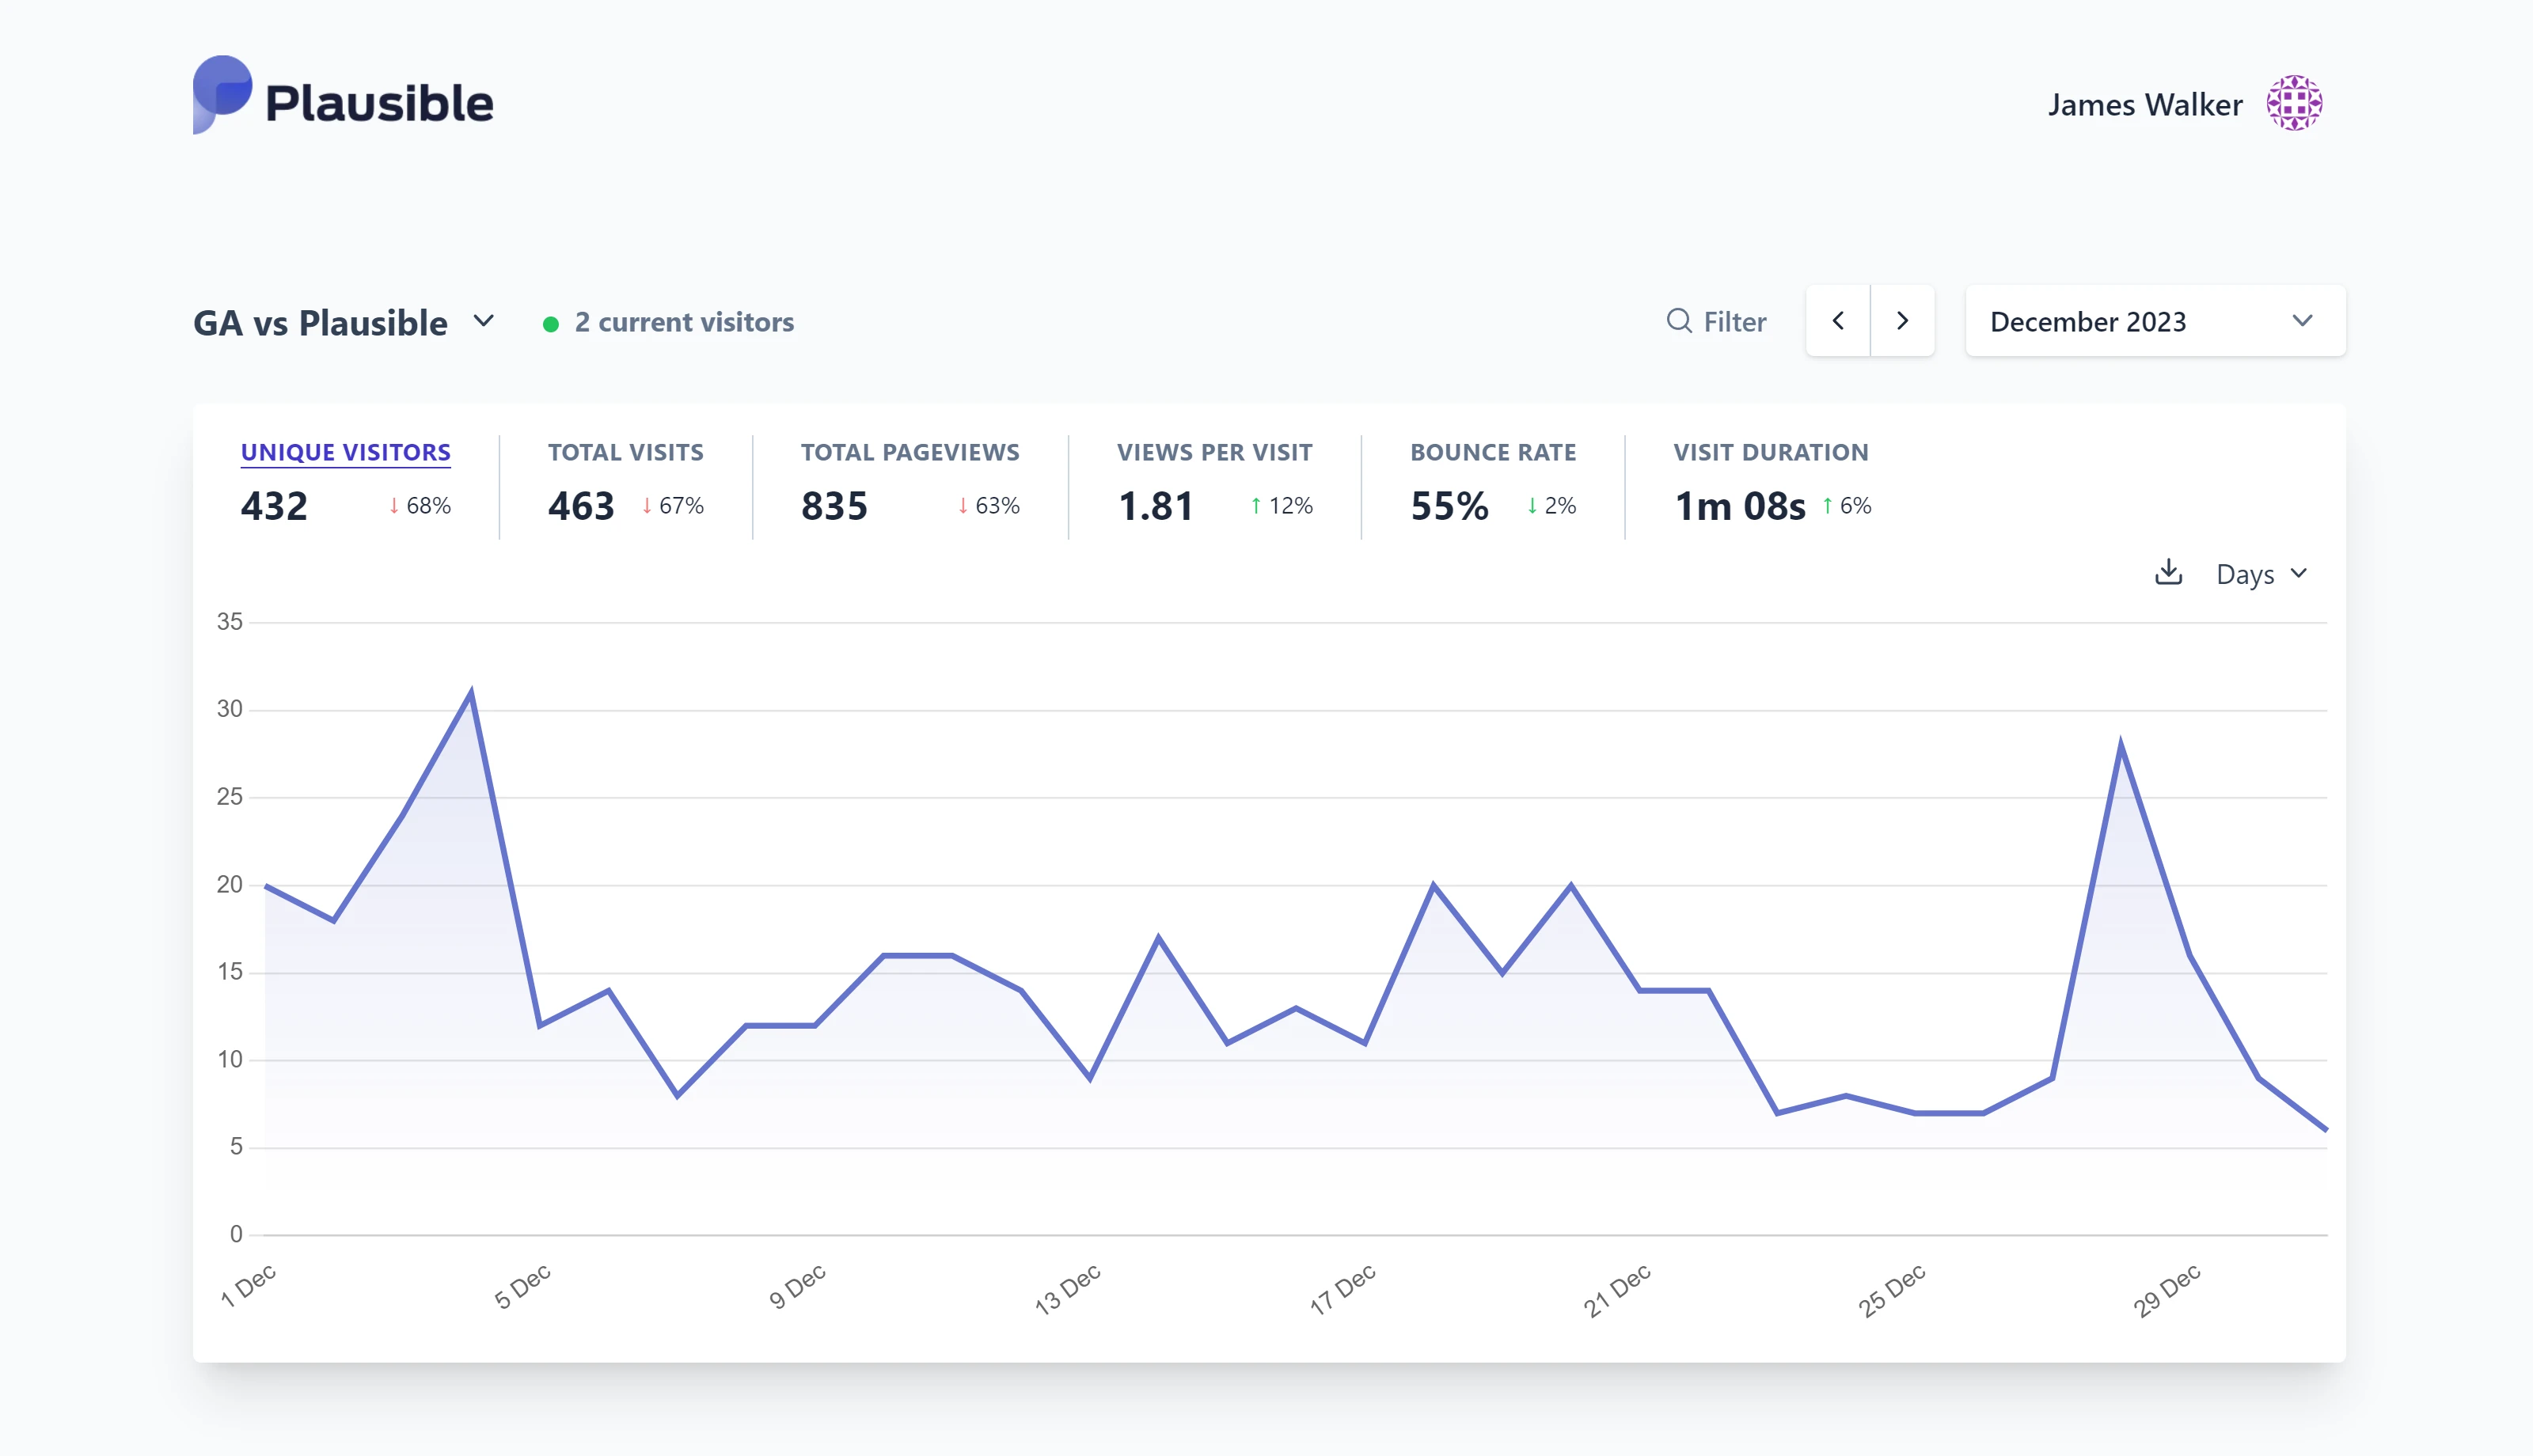
In contrast, Plausible Analytics offers a more user-friendly approach. It provides a clear and concise view of how many people are visiting your website and how this changes over time. It simplifies the data regarding what pages your visitors are looking at, presenting it in an easily digestible format. Terminology is almost self-explanatory - visits, visitors, and pageviews. This makes it much easier for small business owners to quickly grasp their website’s performance without getting bogged down in technical details.
What pages are they looking at?
Google Analytics
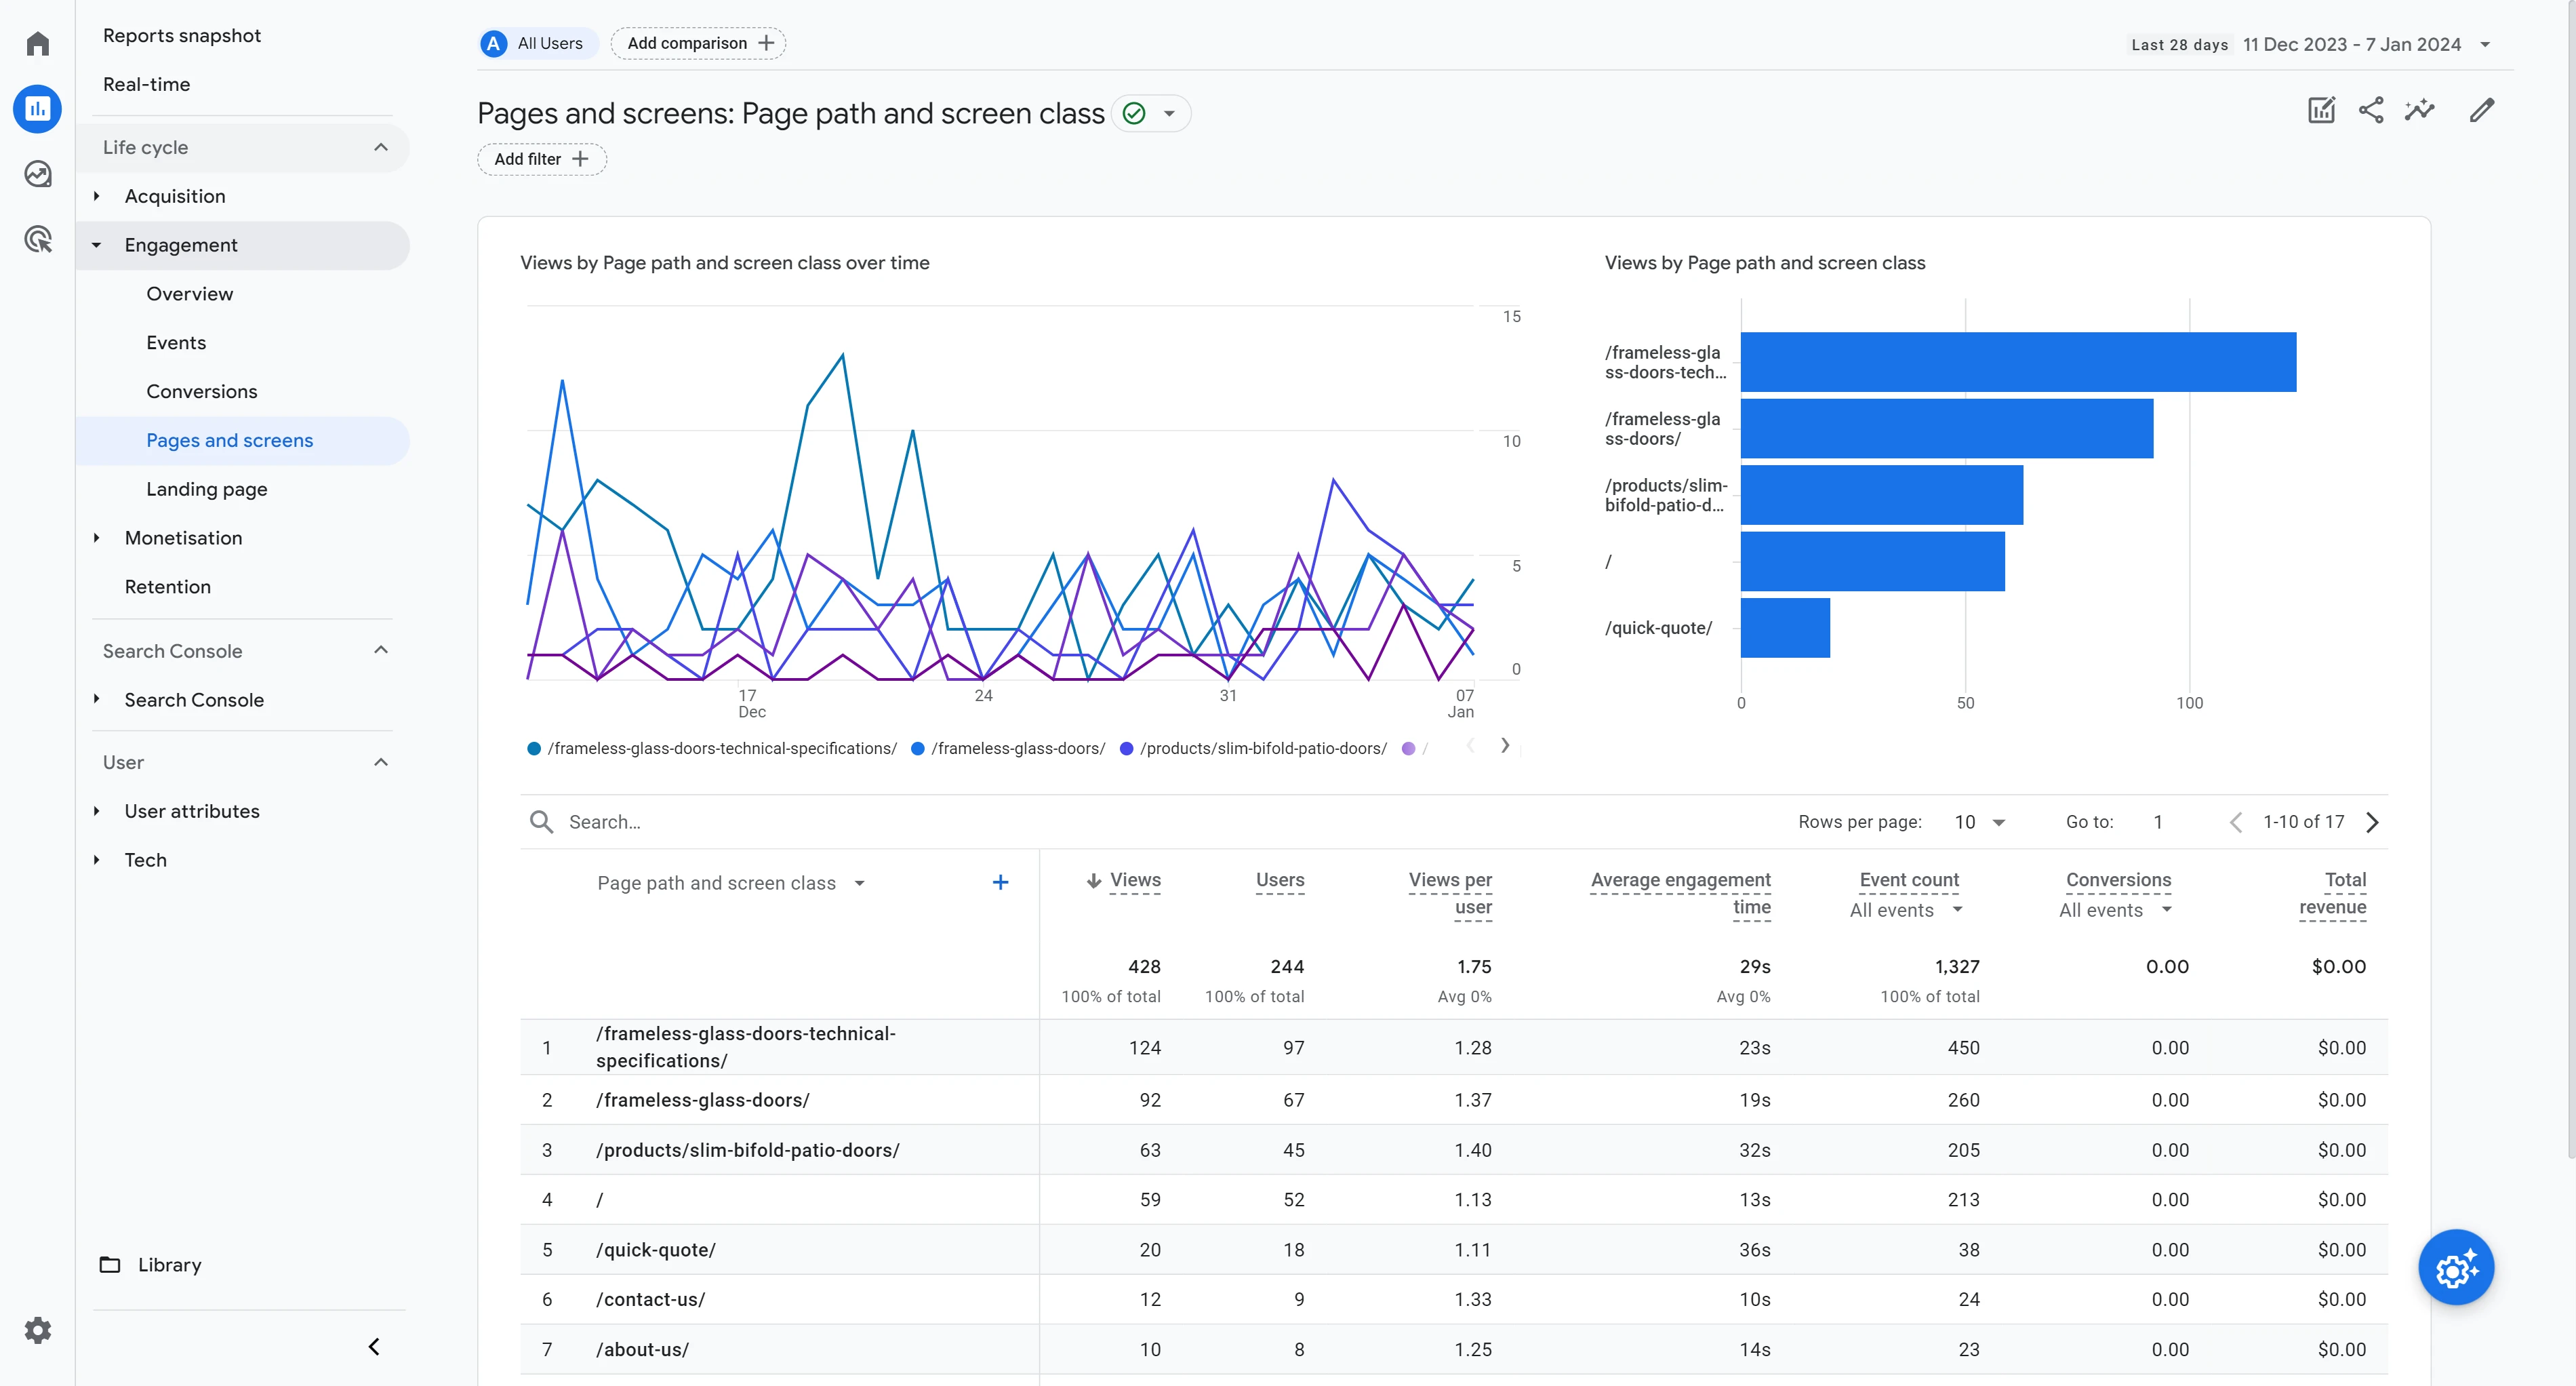
Understanding what pages visitors are exploring can be equally confusing. You can find this information on the views by page title and screen class over time chart (see line graph in screenshot above), but making any sense of this is challenging due to poor design. The chart plots only a subset of pages without displaying views for the others; it utilizes similar colors for each line, making differentiation difficult, and the key or legend often necessitates scrolling. Additionally, it only shows daily views. Website traffic almost always varies over the course of the week, so a weekly total or moving average would be much more helpful in my opinion, especially for websites with a weekly visitor count in the tens or hundreds.
There are advanced features to allow you to delve deep into visitor interactions with your website. For example, it measures the amount of time users spend on each page, and interactions on pages such as scrolling and filling out forms. These data can highlight which pages are capturing attention and which ones may need improvement. You can also visualize the path visitors take through your site, which pages typically serve as entry points, and which ones might be causing them to abandon it. However, there is a steep learning curve. Sorting through extensive reports and metrics to find actionable insights requires time and expertise. For small business owners or entrepreneurs without a dedicated analytics team, this can be a significant challenge.
Plausible Analytics
Clicking a page allows you to view how its popularity is changing over time. The charts can be aggregated by hour, day, or monthly traffic. You can also expand the total period to show any time interval between 24 hours and 3 years for a broader perspective on your data/engagement.
Plausible does not measure page scrolling, and whilst it does give an approximate visit duration and time on page statistic, these are not directly measured. However, a dedicated developer can add these features otherwise present on Google Analytics and in fact Boujee Brands has made this a standard feature for our analytics solution using Plausible.
Who is viewing my website?
Google Analytics
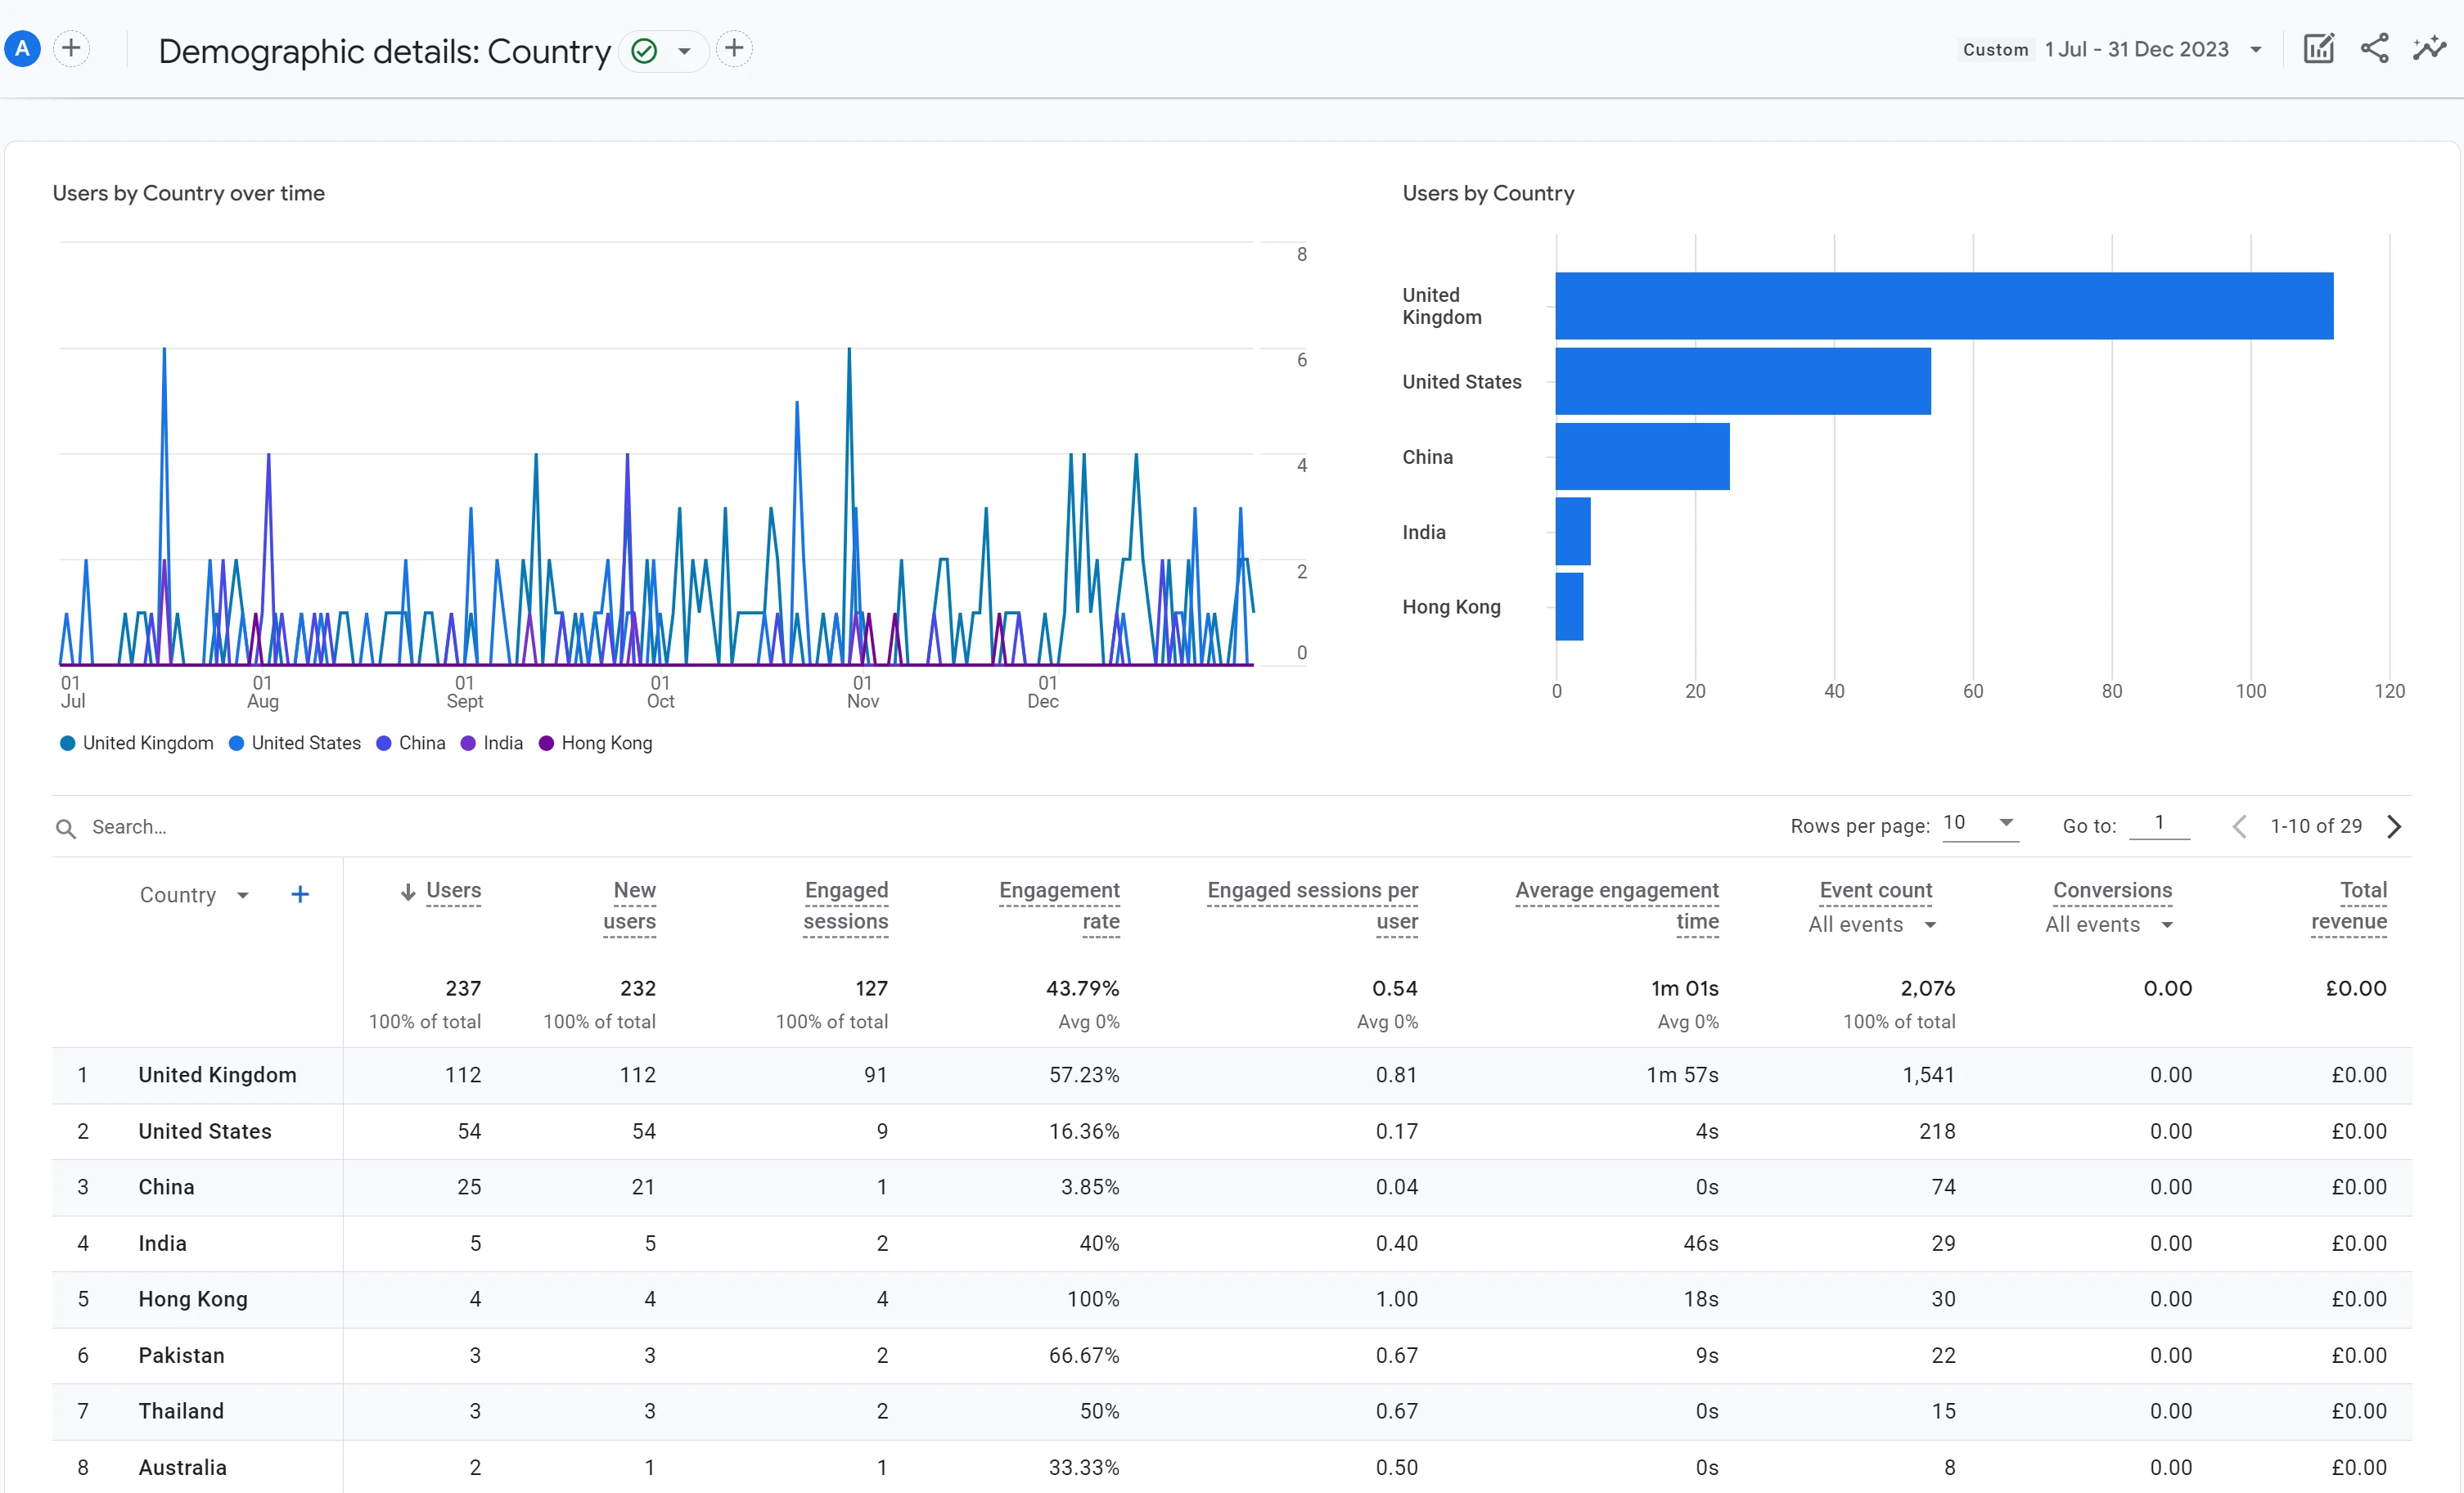
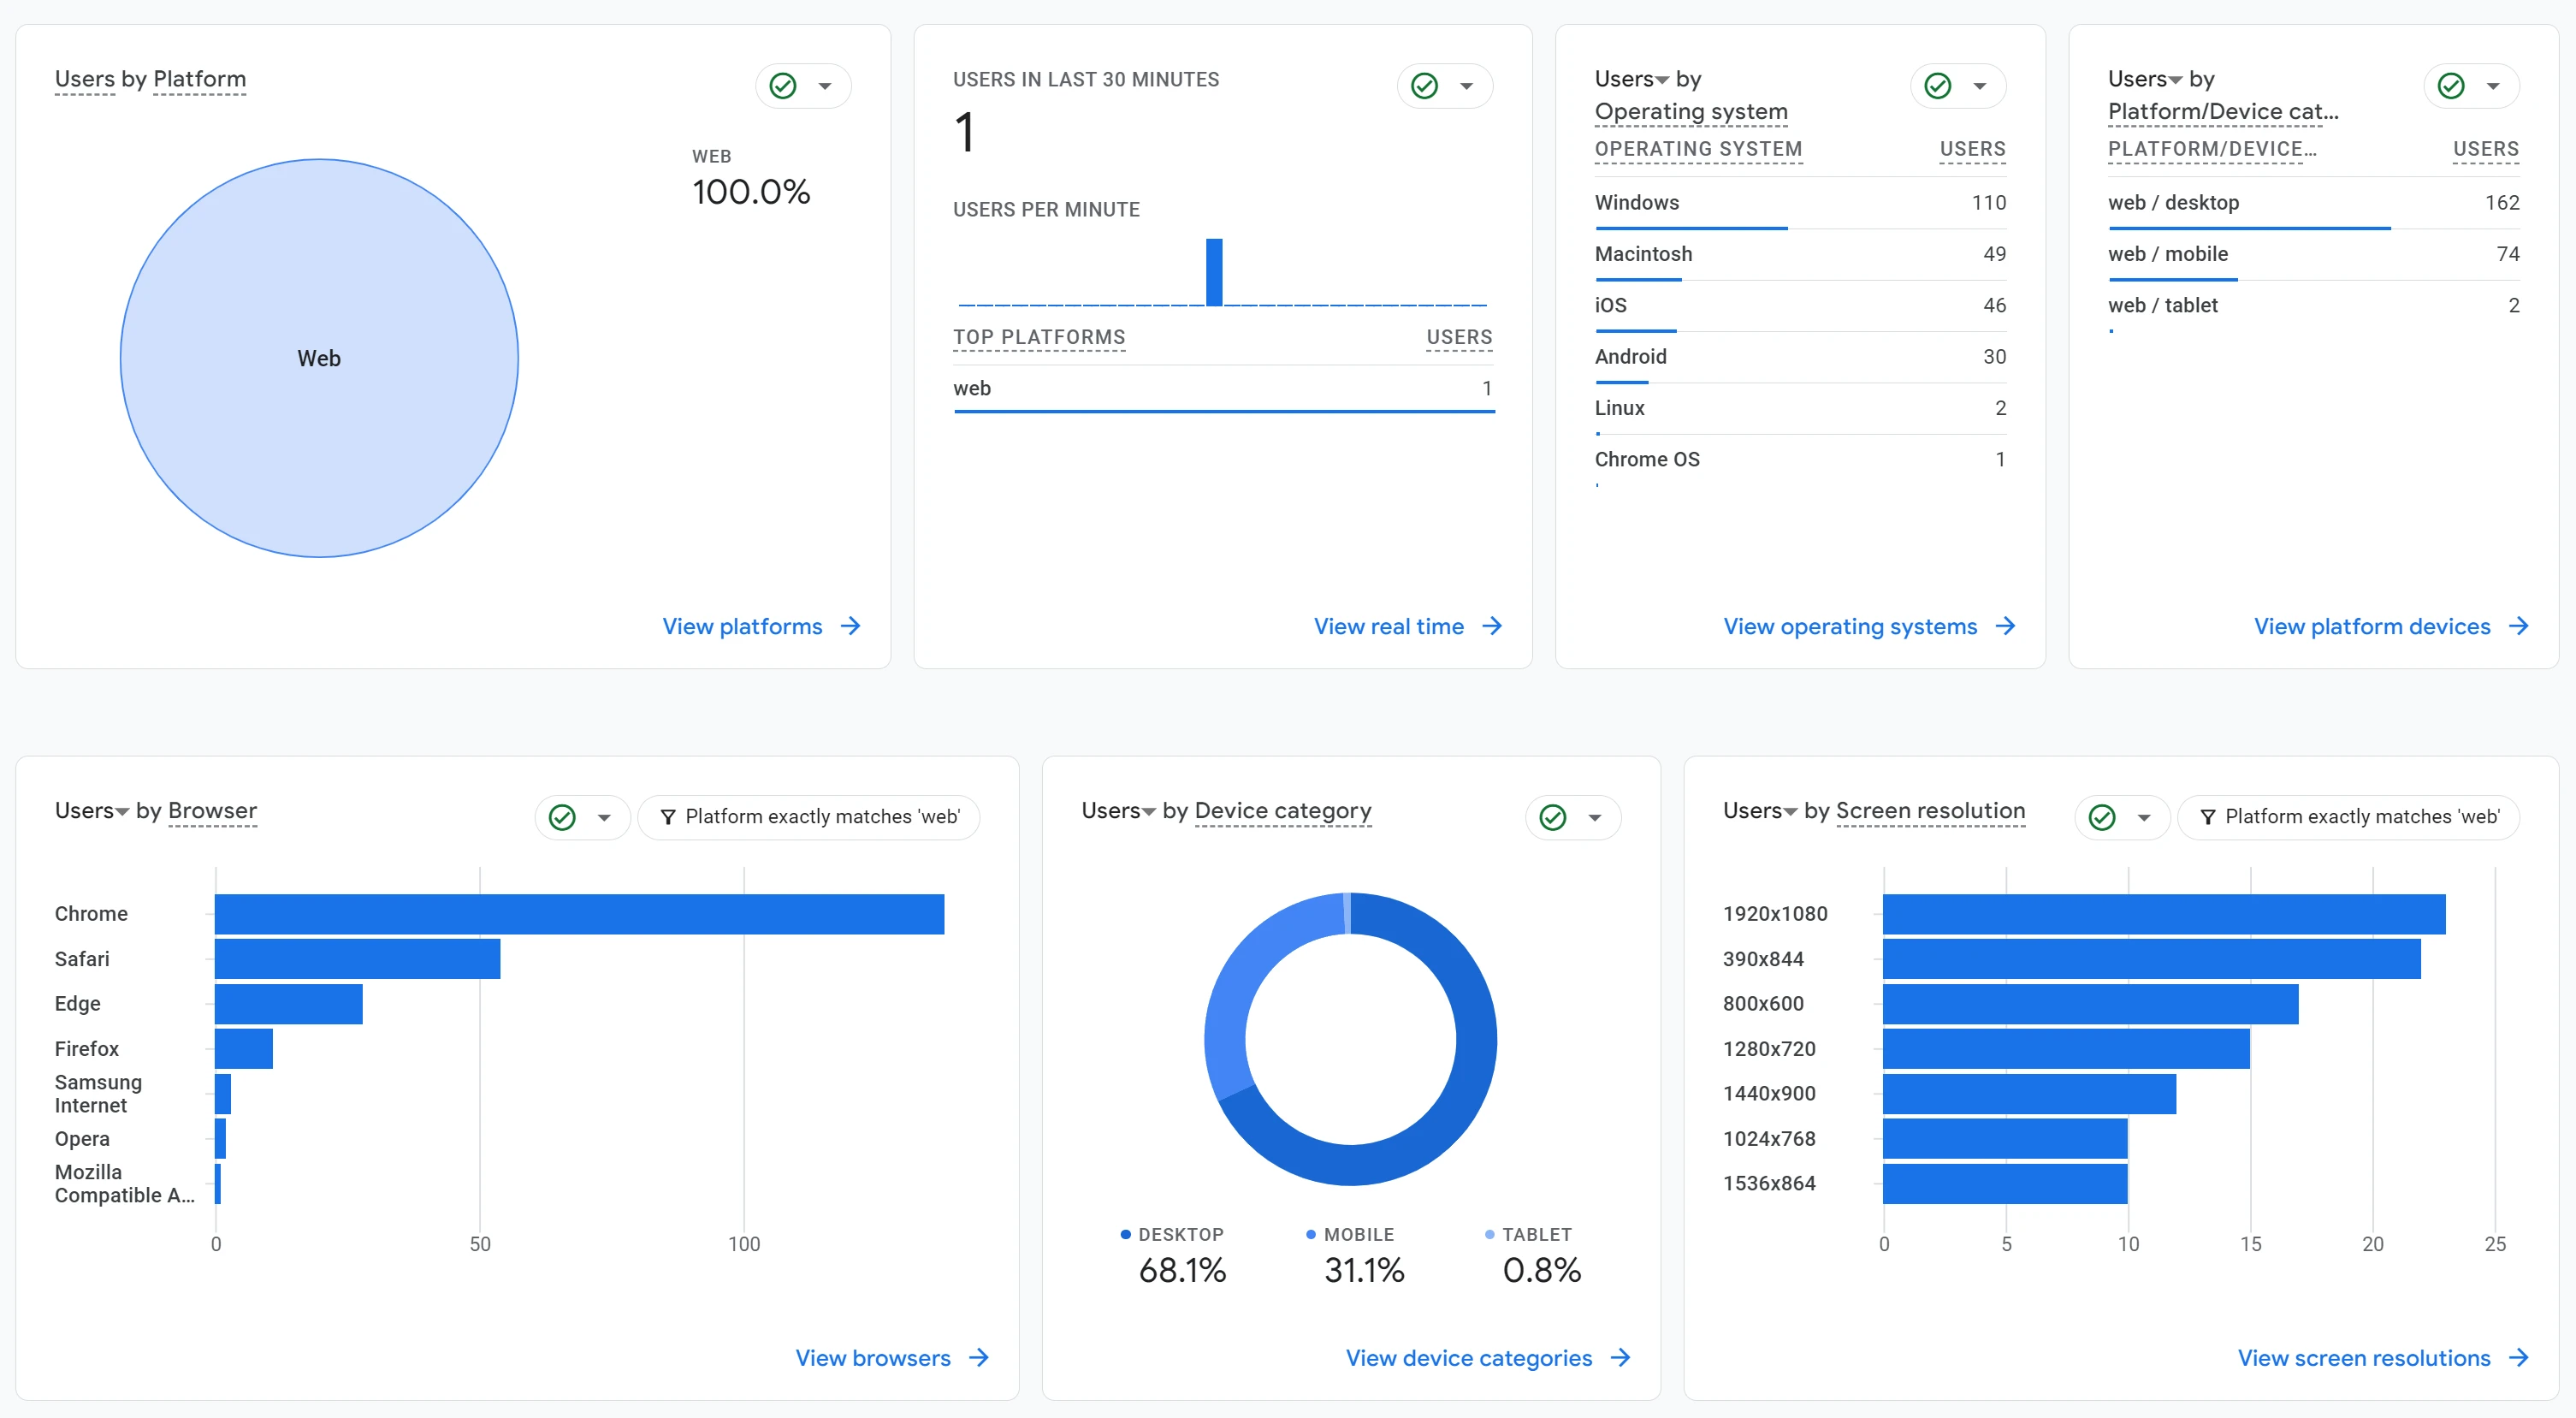
Google Analytics provides extensive data on user location, breaking down traffic by country, city, and even specific regions. This is complemented by insights into the types of devices visitors are using (like mobile, tablet, or desktop), their screen resolutions, operating systems, browsers, their browser’s language setting, and more. If a segment is performing poorly, this will allow you to troubleshoot their native experience and work on determining why that is the case.
Age, gender, and interests (such as “Movie Lovers” and “Business Professionals”) of website visitors can indeed be analyzed through Google Analytics. However, small businesses might find these metrics less accessible, as such data isn’t collected automatically. To access these insights, specific configuration adjustments are needed, and certain minimum user thresholds must be met. There are also significant privacy considerations to be aware of. Many users are justifiably concerned about Google collecting data on their browsing habits to infer their age and gender, and then making these estimations available to Google Analytics users.
Plausible Analytics
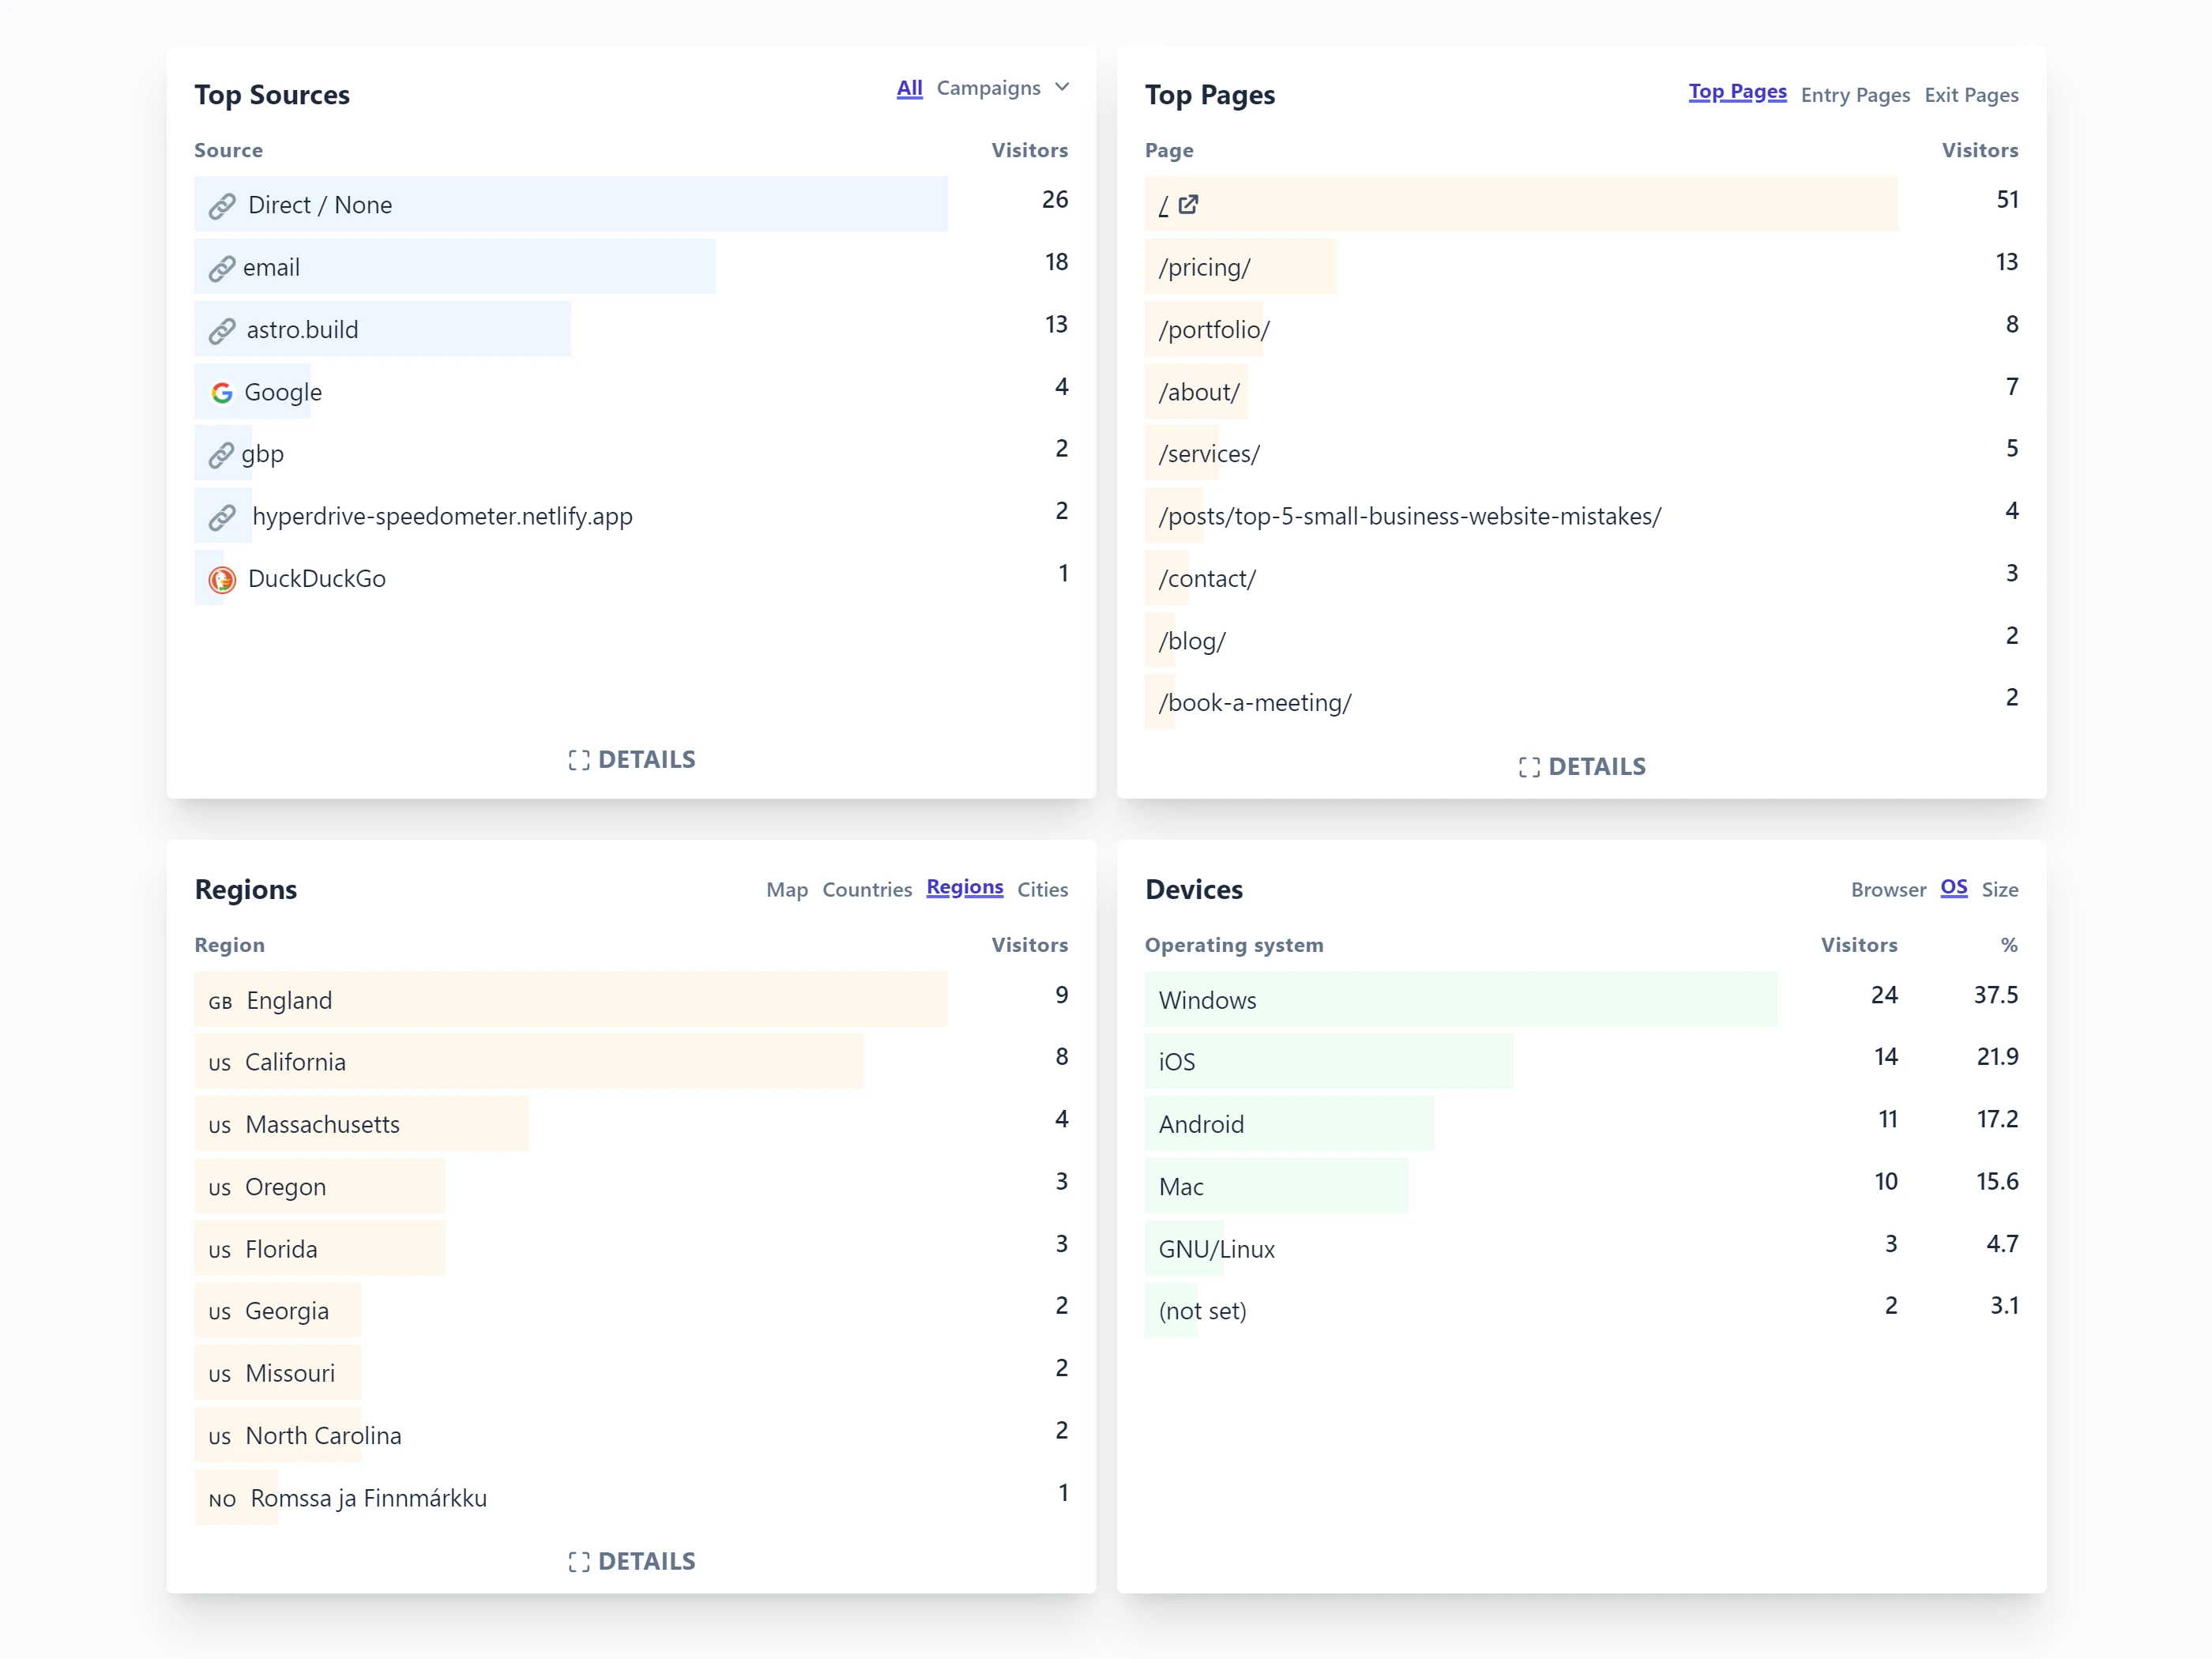
Plausible Analytics takes a more streamlined approach. It offers basic information on user location and device type but does so with less granularity than GA, this makes it easier to use for small business owners who do not require a large enterprise solution. Plausible prioritizes user privacy and data simplicity, so the data is more generalized and less detailed.
This makes Plausible a good choice for users who prefer a straightforward, less intrusive approach to analytics, especially if they are more interested in overall trends rather than detailed, user-specific data.
As with Google Analytics, you can view the approximate location of your website’s viewers at the country, region (e.g. their US state), and city. In our experience, the city-level data is often less accurate than Google Analytics, especially for more rural areas, and especially outside of the US.
Device size is given as one of three categories: mobile, tablet, and desktop. Screen resolution data and browser language is not collected as of writing. If you or your developer is familiar with JavaScript and you’re on their Business Plan (see pricing section below), this can be done fairly easily using the Custom Properties feature.
Google Analytics vs Plausible Analytics: pricing and setup comparison
How easy is it to use?
Google Analytics
Setting up Google Analytics can be a complex process, especially for those without technical expertise. There are many guides available online due to its popularity, and hundreds of plugins are available to simplify the process for website builders and content management systems like WordPress. Many of these guides and plugins quickly become outdated, however. For WordPress users, the Site Kit by Google plugin is a popular plugin to set up Google Analytics. I often see websites which it hasn’t been configured properly, such as having an outdated tracking code which no longer works, or have multiple tracking codes on the same page. This can have a noticeable impact on website loading times.
As with most Google services, technical assistance is essentially non-existent for individuals and smaller customers. It is not possible to speak to an employee, you are limited to community forums and online guides and documentation.
Plausible Analytics
Plausible, on the other hand, is designed for easy setup, making it accessible even for those with limited technical skills. It has an excellent WordPress plugin, and great documentation.
In my experience, customer support is friendly and very responsive. They are available by email.
How do I access it?
Google Analytics
To set it up, you will need to go to the Google Analytics website, and follow the instructions. A Google account is required. You may add other team members if you wish, and it is possible to limit their access - to only viewing the analytics data but not changing important settings - for example.
Once set up and configured, the website is the primary way to access Google Analytics. A mobile app is also available, but is limited in functionality. For advanced reporting and visualization, it can be connected to Google Data Studio. This allows users to create custom dashboards and reports with more dynamic and visually appealing presentations of data. Various integrations are available for both Google and third-party products, including:
- Google Ads
- Google Tag Manager
- Slack
- Google Sheets
- ChatGPT
- Content management systems (CMS) like WordPress
- Customer relationship management (CRM) software like Salesforce
- Search engine optimization (SEO) tools like Google Search Console, Semrush, and Ahrefs
Warning: many integrations, including most of the above, are provided by companies other than Google. Using them will require sharing potentially sensitive data with third parties, potentially in other countries. You may need to adjust your privacy policies accordingly.
Plausible Analytics
Plausible is typically accessed via the Plausible website. There is no official mobile app, however the online Plausible dashboard works relatively well on mobile devices, unlike Google Analytics. Team members may be added, as with GA. There are fewer integrations available, but official ones include:
- WordPress
- Slack
- Email notifications
- Google Search Console
With that said, Plausible has a small development community that has created unofficial integration solutions for some of the aforementioned Google Analytics integrations (like CRMs, ChaptGPT, Google Sheets, etc).
How much does it cost?
Google Analytics pricing
All of the features which a small business may need are available free of charge.
Plausible Analytics pricing
As of writing, Plausible is billed monthly or yearly, with different tiers available. There is a 1-month free trial. Whilst it is open source software and can be used for free by setting up a server, and downloading and maintaining the install, this is only suitable for advanced users with a dedicated server.
Price plans
| Growth plan | Business plan | Boujee Brands | |
|---|---|---|---|
| Team members | Max 3 | Max 10 | Unlimited |
| Sites | Max 10 | Max 50 | 1 |
| Custom events | Yes | Yes | Yes |
| Custom properties | No | Yes | Yes |
| Funnels | No | Yes | Yes |
| API access | No | Yes | No |
| Cost | From $90 /year | From $190 /year | Included with our services |
Pageview limits
| Pageviews/month | Growth plan | Business plan |
|---|---|---|
| 10,000 | $9/mo | $19/mo |
| 100,000 | $19/mo | $39/mo |
| 200,000 | $29/mo | $59/mo |
| 500,000 | $49/mo | $99/mo |
| 1,000,000 | $69/mo | $139/mo |
| 2,000,000 | $89/mo | $179/mo |
| 5,000,000 | $129/mo | $259/mo |
Conclusion: what’s the best analytics tool for small businesses?
Both Google Analytics and Plausible Analytics have their strengths, but they cater to different needs. Google Analytics is a suitable analytics platform for those who require detailed data and can navigate its complexity. Plausible is better for small businesses seeking simplicity and clarity in their analytics. Choosing the right analytics service depends on your business’s specific needs and your comfort with data analysis. Remember, the right analytics tool is a gateway to understanding your audience and driving your business forward.